The Numbers
Various other commitments have slowed me down over the last few days, but I want to turn now to the question of numbers. As I discussed in Part 3, the definition of a pandemic is a disease that affects a large number of people throughout the world. One of the difficulties in assessing events as they happen is that we often know less about the present than we do about the past. With the past, we have the benefit of knowing where things are going, how the story ends, and we also have the time to gather information from many sources, the time to organize information and sift it. The coronavirus pandemic has been a blogger's and even more so a Tweeter's kind of news story. There are multiple online data sources which are posting data in what seems like nearly live time. You can go to the John Hopkinds University dashboard or the Worldometers coronavirus webpage or the Covid Tracking Project and see new statistics appearing every few minutes. The CDC and many states, counties, and even cities have set up their own data dashboards where they publish daily data. People representing important institutions have gone on TV and announced that they have built statistical models which can predict what will happen if various actions are taken and how the outbreak will progress. All of this gives an appearance of a situation where we know a great deal and can make the predictions with all the authority of techs crouched over computer screens and plotting the trajectory of a space capsule.
And yet, think for a moment about where all this seemingly abundant data comes from.
A disease is not a web stat or a stock market price or some other thing which is collected directly into a computer at the moment it happens. Someone gets sick. Maybe they take a test. Maybe they don't. If they do take a test, some amount of data may be collected about them: when did they get sick, how old are they, where have they been, who have they been near. Or it may not. That data may be collected to some central repository in a useful way, or it may not.
Someone dies. That person has been sick. Was it coronavirus? Was the person tested? How sick were they before? How old were they. When and where did they even die?
When people are massively overwhelmed with the difficulty of fighting a serious disease outbreak, they may get messier about collecting data. If they have almost no infections of a particular disease in the area, they may not think to test for it. Or they may try to test, but not have a good way to report the results.
The result of all this is that although we receive new data constantly, the data we have is at best a partial view of what is really going on out in the world, and the relationship between this partial view and the world itself is a matter of some dispute. Combine this with people who have decided to address the facts ideologically or who are determined to either minimize or maximize the pandemic in order to alleviate their particular emotional reactions to it, and there is a great deal of confusion out there.
I'll run through the basic numbers and to what extent we do or do not know them.
The number of people who now have or have in the past been infected by the SARS-CoV-2 virus: This number is hard to know with any certainty right now, because not all people who are sick are tested, sometimes the test provides a false negative result, and many people (though what percentage we don't know) are infected by the virus and are contagious but don't show any symptoms. Probably at some point in the future epidemiologists will have some sort of a backward looking estimate of the number, but even that will be based on assumptions we can't totally prove. This is no different from any other major disease. We do not, for instance, know with any great certainty how many people had the 1918 Spanish Flu, or how many people had AIDS or Ebola, etc.
The number of people who have tested positive for actively having COVID-19 (the disease caused by the virus SARS-CoV-2): This number is clearly reported and you can download the data from many sources. The only thing that is a little bit confusing is knowing when the person who tested positive first got the virus. There can be a lag of some days or even a couple weeks between when someone gets the virus and when they are tested and get a positive result. This means that the number of positive tests that are recorded on a given day can be a mix of people who contracted the virus up to a few weeks before and people who got it quite recently.
The number of people who have ever had the virus: This can be estimated with antibody tests, tests that analyze someone's blood and look for the antibodies that the body makes to fight off the SARS-CoV-2 virus. If someone has those antibodies, we can conclude that that person at some point contracted the virus. There have been a number of tests of this type conducted in different regions and with different sampling techniques. They have so far produced widely varying estimates of how many people have had the virus in different parts of the country. I think in the long run, major well run studies will establish this pretty clearly, but right now there are a lot of flaky, tiny studies out there, some of which are being run by people with agendas or with very poor methodologies.
The number of people who are hospitalized as a result of the virus: This number we know moderately well, so long as enough tests are available to test people who are under care because of symptoms which appear to be similar to the virus. However, here we run into reporting issues: not all hospitals have the time and resources to report on how many COVID-19 patients they have consistently, and not all cities and states are collecting and tabulating the data in the same way. This is something that in the long run will probably be known pretty well but which right now can be tricky to sort out clearly.
The number of people who have died as a result of the virus: You would think it would be pretty easy to know if people had died or not. Overall, I think number of deaths due to COVID-19 is probably one of the clearer measures that we have right now. However, even here we have the difficulty of diagnosis. If someone died after having been sick with symptoms that look like COVID-19, but that person has not been tested, whether they are classified as being a COVID-19 death will depend on the reporting agency tabulating the results. Some countries are also overwhelmed or do not have very good data gathering systems, and so their tabulations of deaths are simply not good. A few countries don't even keep accurate records of how many people die. And even in the US, although we have pretty meticulous data on deaths, our systems got gathering it are slow, as cities report to states and states report to the CDC. As a result, although through one system we have people reporting to the CDC very quickly how many people are dying of COVID-19, our data on how many people have died in total is partial for up to a couple months until all the data gathering and cleaning is done.
The percent of people who get the virus who die as a result: This number is trickier to get than you would think. Say you pull up a dashboard right at this moment and you see that the US has 1,573,073 cases of COVID-19 to date and 93,653 deaths. Simple division would tell you that 6% of cases result in death. This is called the Case Fatality Rate or CFR, and you'll hear that number thrown around. But as I discussed above, although we know how many people have tested positive for the coronavirus, we don't know how many people have actually had it. We can be pretty sure that we haven't tested very person who is sick. So the denominator of that fatality rate equation if we wanted to calculate the actual changes of someone dying due to the virus is some number bigger than 1.5 million. But how much bigger? If the number of people who have actually had the virus is five times larger, then the fatality rate is 1.2%. If it's ten times larger, then the fatality rate is 0.6%. If we've only tested 1 out of a hundred of the people who are actually sick, then the fatality rate is only 0.1% and is similar to the seasonal flu. But if we were to assume that the number of people actually sick is 100x the number of positive tests, we'd have to say that 157 million people have had the virus, almost half the US population. That seems very, very hard to believe, and it doesn't align with any of the serology tests I mentioned above. FFor instance, an antibody test in New York in late April found that about 25% of people in New York City (the area hit by far the hardest) had had the virus. Given the number of deaths New York City had experienced at the time, that would suggest an average fatality rate of around 0.5% or about 5x the fatality rate of the seasonal flu. (The Santa Clara study that the linked article also mentions has been widely questioned and should probably be ignored because most of the positive may have been false positives.)
All of this should make clear, there are a lot of things that we don't know when it comes to the numbers that surround the pandemic. What basic things can we draw from the available data? What things can we conclude are definitely not true?
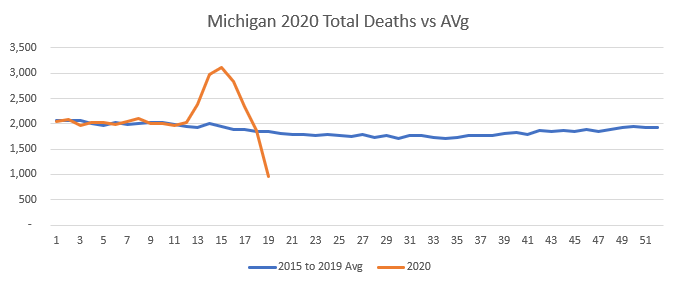
We know that it is a serious disease which is capable of spreading through a significant percentage of the population and causing a large number of deaths. And we know that these deaths are not just expected deaths from flu or pneumonia that are being mis-categorized. Let's look at some New York data to validate this.
The first look is simple. Pulling data from the COVID-19 Project, I built a basic chart of New York State reported COVID-19 deaths by day with a 7-day moving average:


Now let's look at this year.

We see the same thing with other states we've been hearing about in the news. In New Jersey there are 10,147 excess deaths in the data thus far, with the top week 208% above the average.

So far, the coronavirus is an intensely regional problem. Some states have very bad outbreaks and some have very mild ones. Yet even so, the impact is measurable on a national level even though data is still far from complete for the last couple months.

Even so, you might ask yourself: Why are we shutting the country down? We did basically nothing to stop the 2017-2018 flu season, and we just accepted those "excess deaths" which are themselves in excess of season flu deaths that we suffer every year without shutting the economy down. So why are we doing this now? Is there something acceptable about 38,000 excess deaths that's totally unacceptable about 50,000?
The answer lies in the question. There's been an unprecedented effort to reduce the chances for this virus to spread since we as a country got serious about things in the middle of March. Apple provides a really interesting tool which allows you to see how much people's use of their Maps app to travel had gone down in various areas. Take a look:

Having spent so much time discussing the virus online over the last few weeks, I can already hear someone saying, "What about Sweden? They haven't shut down, and they're doing okay." Well, okay is relative. They're hit much harder than the other Scandinavian countries in terms of deaths so far. But more importantly, just because they haven't had a legal "lockdown" doesn't mean that they aren't circulating a lot less. Here's the same movement graph for Sweden.

So while it's true that so far (and there's a lot of emphasis in that "so far" because our data isn't nearly complete yet) the number of excess deaths we can measure is less than twice that of a bad though normal flu season, that's within the context of an outbreak which we've put the brakes on by having everyone hunker down. And even as people now begin to return to more normal activities, they're doing so with a much greater than normal awareness of avoiding behavior that might pass on a respiratory virus. In that sense, it would seem likely that the virus is spreading significantly more slowly now than in a "do nothing" scenario such as our normal response to flu season. If we were going to try to say whether our response to the risk of the virus was proportional to the danger we faced, we need to look not at what's actually happened (which is 90,000 deaths according to the official tally and 50,000 according to the far-from-complete "excess death" analysis) but rather try to get some sense of what could have happened if we had not acted to drastically slow the spread of the virus.
Let's try a basic range of assumptions that seem within the realm of possibility. We know that there are 330,000,000 people in the US. Say that the ~25% infection rate for New York City which is suggested by antibody tests is actually the outer bound of how many infections a region could have before it peters out due to not having enough non-immune hosts left available. (For comparison, estimates are that it was about 25% of the US population that got Spanish Flu back in 1918 as well.) And say that the 0.5% infection fatality rate that suggests given New York City's death numbers is also correct. 330M times 25% times 0.5% is 412,000 deaths. Let's take that as our low number. For a mid number, let's assume that NYC is actually not at the maximum saturation point for infections. Maybe if we pretty much went about our normal lives about 40% of the population would get the virus. If we assume 40% infections and 0.5% mortality, we get 660,000 deaths. For our worst case scenario, let's imagine a 40% infection rate but also that the fatality rate that I'm estimating is a bit low. What if it's more like 1%, which I think is about the upper bound of the reasonable infection fatality rates that I've seen. Those assumptions get us to 1,320,000 deaths.
So if we hadn't done all this to try to stop the spread of the virus, there's a pretty decent possibility that we would be facing 400k to 1.3M deaths. I think we could all agree that's a really large number, and one it would be reasonable to take some pretty drastic actions to avoid. If the actions we're taking can reduce those down to something in the 100k to 200k range, it seems like that would be a potentially reasonable course of action. (I want to examine in depth the question of whether "lockdowns" actually save lives or just space them out over more time, but I think that needs its own post.)
However, a counter-argument that is often made is that while COVID-19 causes a lot of deaths, those are actually deaths that would have occurred soon anyway. According to this argument, the virus is mostly killing people who are very old and/or have existing conditions that put them in fragile health.
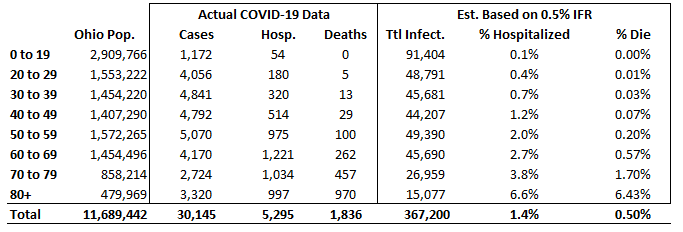
This is to some extent true. Here's a shot of the COVID-19 dashboard for my state of Ohio. I think it does a really good job of showing the dynamics of the virus:

So what does this mean in terms of the actual chance that people with COVID-19 will end up in the hospital or will end up dead? As we discussed earlier, lots of people who have the virus have not actually been tested, so the case numbers don't tell us everything. I also said that 0.5% overall fatality rate for all infections (not just identified cases) seems like a pretty plausible number based on the antibody studies from New York City. So here I've taken the Ohio population, assumed that actual infections are evenly distributed across the population even though the very mild nature of the disease in younger people means that fewer cases have been identified among the younger age groups, and projected an estimated total number of infections based on a total population IFR of 0.5%. (In other words, I first calculated that there were 367,200 infections by assuming that the 1,836 deaths represented a 0.5% IFR, and then spread those infections across the age groups based on the percent of Ohio residents in each age group.)
Well, for a lot of people the virus does give no symptoms at all or very mild symptoms. But keep in mind, we have a lot of people in our country. There are 12.5M people over 80 in the US. Apply these rates across the whole US population and you get to some large numbers. Let's go back to our minimum scenario where 25% of the US population got the virus. What would these hospitalization rates and fatality rates mean in terms of total deaths for different age groups? What I've done here is calculated 25% of the US population as the total number of infections and then distributed those infections evenly across the population according to how many people are in each age group. Obviously, there are a lot of assumptions being made here, but as a conservative scenario I don't think it's unreasonable.

But as we think about how much people would want to avoid getting this disease, how much they would stay away from restaurants and big gatherings in order to stay healthy even if not ordered to, and slow down the consumer economy as they did so, it's worth looking at the other set of estimates. Someone in his forties is almost a hundred times less likely to die if infected with the virus as someone who is 80+, but he's still a sixth as likely to end up in the hospital. While my estimate is that if 25% of Americans got the coronavirus, only 90,000 people under 70 would die of it, over 700,000 people under 70 would spend time in the hospital. Indeed, while 75% of the deaths would be people over 70, more than 60% the people hospitalized would be people under 70. 20% of the people hospitalized would be under fifty. 10% of people hospitalized would be under forty. I think we have to assume that there would be lots of other people who never ended up in hospitals but who felt really, really sick and scared for a couple weeks as they waited to see if they'd end up having to go to the hospital.
There are a lot of things that we don't know about this virus, and there are a lot of things we can reasonably argue about in how to respond to it. However, I think that this examination of the numbers underlines that while there have definitely been panicked numbers thrown around by people who didn't know what they were doing (I don't think that claims we'd see 5-10 million deaths ever fit well with what we knew, even back in February) this is a serious disease which, if left unchecked, could be responsible for a lot of deaths and a great deal of suffering. Hopefully this provides some insight into just what the dimensions of those possibilities are (and aren't.)
In my next post, I'll talk about the measures that have been taken to suppress the virus, including the "lockdowns" which are the subject of so much political dispute.


7 comments:
Interesting... The maddening thing is not knowing how many are or have been infected. Gov DeWine has been promising for at least a month now to sample like 1000 Ohioans to try to get a feel for how much the virus is out there, but so far as I’ve heard there’s been nothing on it. It looks like you’re using about 10x as many Ohioans have had it then is reflected in the case stats; for my projections I’ve been using 3x, 5x, and 10x, and I have it growing at 1.5% a day (in order to try to estimate when we’ll be near 60% or “herd immunity”).
What makes this especially complex is it appears not just age related but also weight/sex/hypertension/etc... And viral load as well surely. Be nice if there was a calculator out there that you could put in your demographic and underlying conditions and out would come your % of getting hospitalized.
Overweight men past the age of 40 tend to have a bad time with it. A decent example is Boris Johnson. At some point in March he caught the virus. On 3/26 he was feeling unwell and tested positive for covid. 11 days later his condition deteriorated and doctors discussed putting him on a ventilator; Johnson fiercely resisted that idea. On April 12, after 17 days with covid, he was released from the hospital. At 5’9’’ 245 lbs he’s not morbidly obese (BMI 36) but obviously obese.
From the Wall Street Journal:
“Mr. Johnson, 55 years old, has been chastened by the experience, say people who know him. They say his illness has left him feeling occasionally tired [now two months after getting the virus] and made him more cautious about how the government should go about eventually lifting a lockdown. He’s trying to lose weight, concerned that his physical condition may be partly to blame for the severity of his sickness.”
fwiw I project my chance of getting hospitalized at between 10% and 40%. Wide range I know.
Yes, it would be hugely helpful if a number of areas would run antibody tests on a random sample of people in order to get a handle on the number of people who have had the virus. That's one of the big areas of uncertainty that has people making conjectures in order to get some sort of feel for what must be going on.
We are in a local hot spot- Bergen County NJ which has a population of approximately 1Million residents. Latest figures 5/22 are 17,683 presumptive positive & 1515 deaths. Of those 885 deaths were in nursing homes and long term care facilities.
I had antibody test which came back negative. I was surprised because I had been in Rome airport, Seattle, Barcelona and Madrid between October and Mid February. The only person whom I know who has tested positive for Covid19 was my brother who is a first responder FDNY. His entire firehouse got it in early March.
Another brother is a Catholic Chaplain at a large regional hospital in Bergen County. He was tested weekly and has not been exposed. According to him the biggest factor in death was co-morbidity _ high blood pressure obesity and diabetes being the top three. In my opinion this is a healthcare facility crisis. Our governor also ordered hospitals to release patients to nursing homes& rehab facilities.
I'm really appreciating this series.
Waiting with baited breath. Checking everyday for the next one... Why? Because I don't have time in my life to be on the internet and I trust you with this data. "To thine own self be true..."
This was a good faith effort, but the answer was staring you in the face the whole time
Post a Comment